
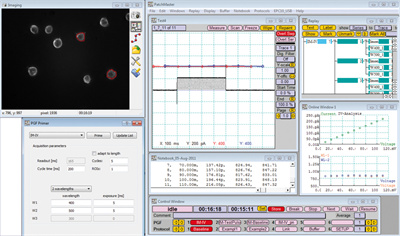
SmartLUX allows to perform simultaneous image acquisition and electrophysiological recordings. The timing of a fluorescence excitation light source, the camera and the electrophysiological command signals are synchronized by the Pulse Generator of PATCHMASTER.
Fluorescence mean values from regions of interest (ROI), which can be marked by the user in the image, are plotted together with e.g. the current trace in the Oscilloscope window and stored together with the other data in PATCHMASTER's data tree.
When stepping through the data tree, SmartLUX shows the corresponding image. In case more images have been acquired during a single sweep, the individual images are shown when stepping through the data points of the fluorescence trace using the scan function of the Oscilloscope
 SmartLUX vs. DocuLUX
Comparison Sheet Electrophysiology&
Live-Cell Imaging SmartLUX Manual
Fluorescence Excitation light sources which can be controlled in the same way as:
Polychrome and Oligochrome from TILL Photonics
OptoScan from Cairn Research
DG-4/DG-5 wavelength switcher from Sutter Instrument Company
Lambda 10 filter wheels from Sutter Instrument Company
DeltaRAM monochromator from PTI
Features:
General
Live Mode
Snapshot
Auto and manual scaling (Min / Max)
Histogram
Mouse tip shows pixel position and intensity value
Up to 3 different wavelength in a sweep recording
Online plotting of mean fluorescence values from ROIs together with sweep data
Direct link between image data and electrophysiological/electrochemical data when replaying sweeps of electrophysiological data the first image taken in the sweep is automatically shown
When scanning through individual data points of a fluorescence trace the corresponding image is automatically shown
Multiple ROIs can be drawn and processed. For each ROI a fluorescence trace is created in PATCHMASTER and filled with the fluorescence mean values calculated from the ROI. Those data are stored in the PATCHMASTER data file and can be displayed in the Oscilloscope and processed in the Online analysis as other Patchmaster data.
The ROI mask is saved with the image stack
Background subtraction on ROI mean fluorescence values
Calculation of fluorescence ratios
Calculation of free calcium concentrations